Bitcoin could see a breakout in September, based on historical chart patterns, with $86,000 potentially being the next major price target.
Bitcoin Price Prepares for a September Breakout
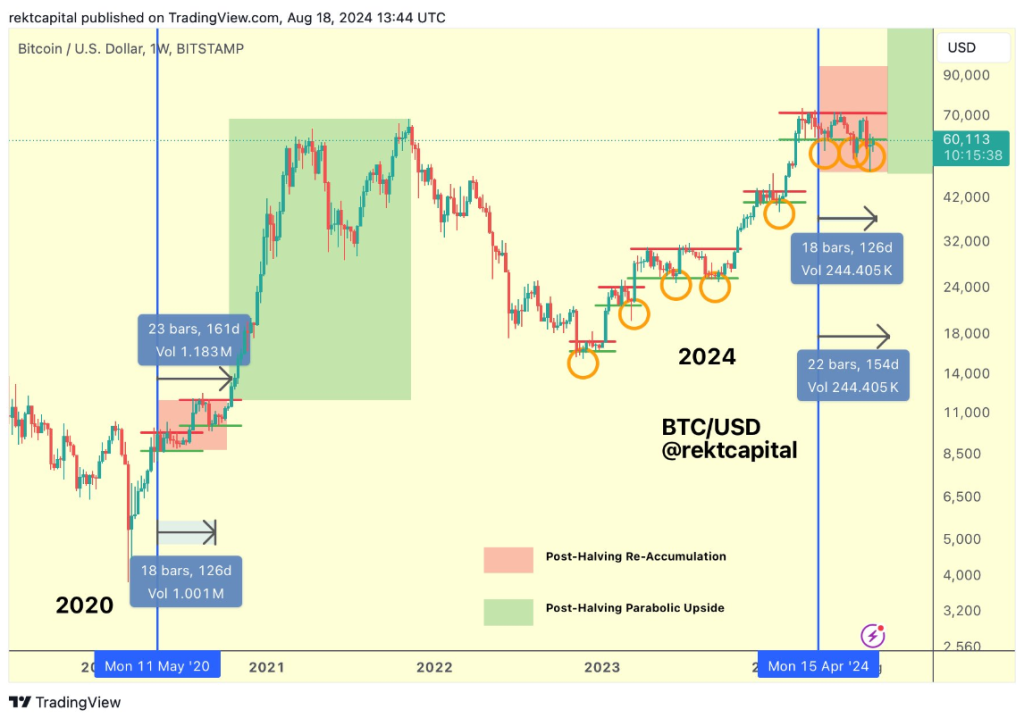
Bitcoin (BTC) may be gearing up for a significant breakout in September, according to well-known analyst Rekt Capital, based on chart patterns following previous halving events.
In a post on X (formerly Twitter) on August 18 to his 493,000 followers, the analyst wrote:
‘Bitcoin tends to enter the Parabolic phase of its cycle approximately 160 days after a Halving. If history repeats, Bitcoin could be just over a month away from breaking out. That’s by the end of September.’

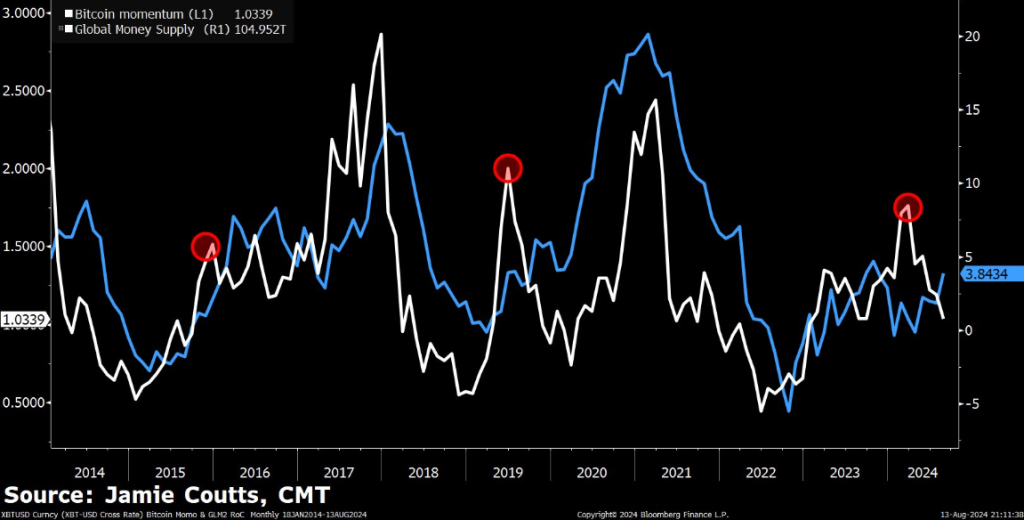
The macroeconomic picture also looks promising. Specifically, Bitcoin may be poised for a breakout due to the increase in global M2 money supply, according to Jamie Coutts, lead cryptocurrency analyst at Real Vision.
Coutts wrote in a post on X on August 13:
‘Over the past decade, Bitcoin has often bottomed out a few months before global M2 money supply bottoms. Then, it surges, outpacing liquidity growth, with a mid-cycle correction.’

The analyst added that the increase in global liquidity from the M2 money supply, combined with the U.S. spot Bitcoin ETFs, creates ‘a perfect setup’ for Bitcoin.
Moreover, the growth of inflows into Bitcoin ETF funds could create additional advantages, as for two consecutive days last week, net inflows reached $35.9 million on August 16, according to data from Farside Investors.

Last quarter, institutional adoption of Bitcoin ETFs increased by over 27%, with 262 new companies investing in spot Bitcoin ETFs.
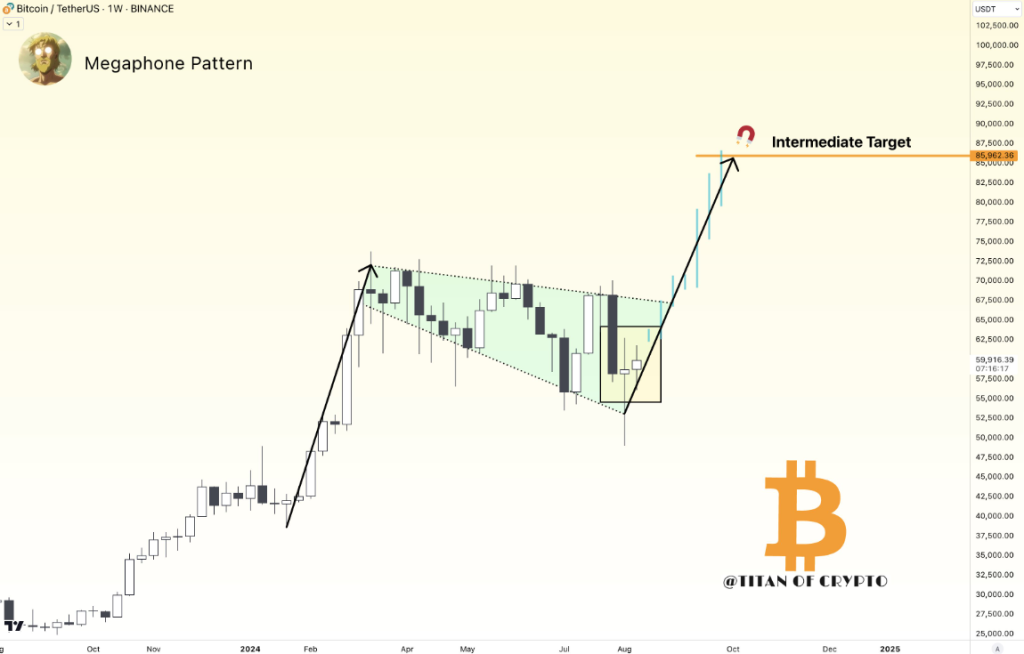
The ‘Megaphone’ Pattern Suggests a Price of $86,000
Bitcoin’s next major price target could be around $86,000 if it successfully breaks out in September, according to prominent crypto analyst Titan of Crypto.
In a post on X on August 18, the analyst wrote:
‘Main Bitcoin target: $86,000. Do you bet on this Megaphone pattern playing out?’

The Megaphone technical chart pattern includes at least two higher highs and two lower lows. It occurs when the market is extremely volatile and often marks a major market top or bottom.
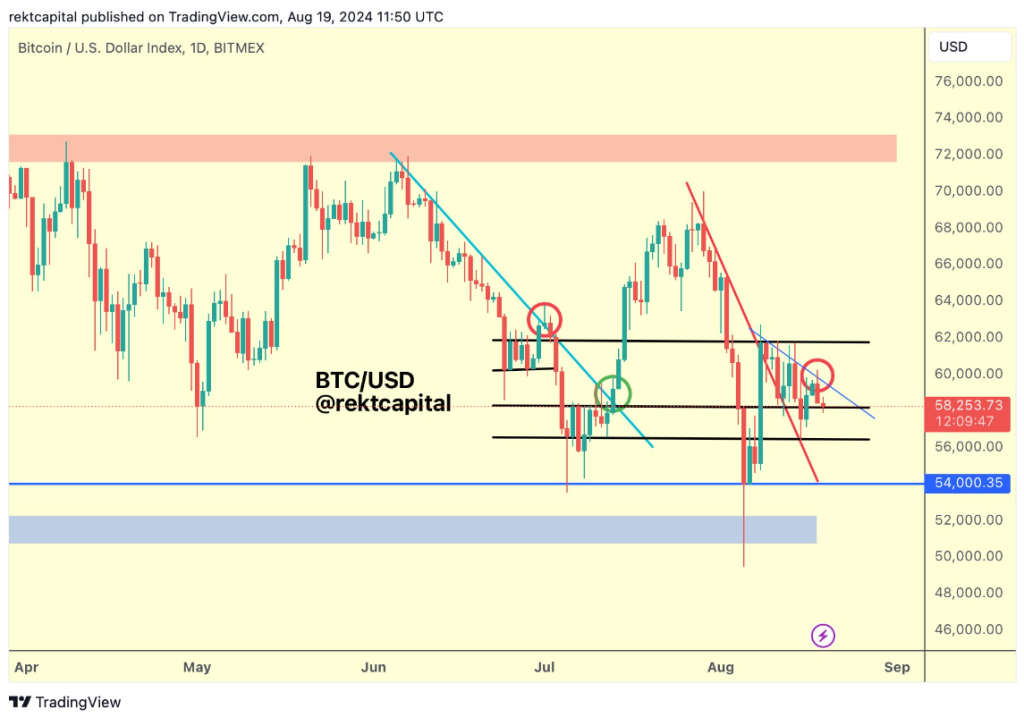
However, Bitcoin has yet to close a daily candle above its current descending trendline, which could mean a short-term price drop, Rekt Capital wrote:
‘The reality is that Bitcoin will continue to drop until it breaks out. But Bitcoin only needs a daily close above the Descending Trendline to change everything.’

These ‘lower levels’ could mean retesting the $54,000 and $50,000 support levels before September.
You can check the BTC price here.
Disclaimer: The article is for informational purposes only and not investment advice. Investors should do their own research before making decisions. We are not responsible for your investment decisions.


