

Bitcoin’s price action seems to be heading toward a “Death Cross,” but a crypto analyst believes it may not be “too dangerous” based on historical patterns. Instead, it might be a bear trap before Bitcoin enters a “super bull cycle,” looking at BTC’s 7-year super cycle.
A death cross is a bearish signal that occurs when the 50-day simple moving average (SMA) of an asset’s market price falls below the 200-day SMA.
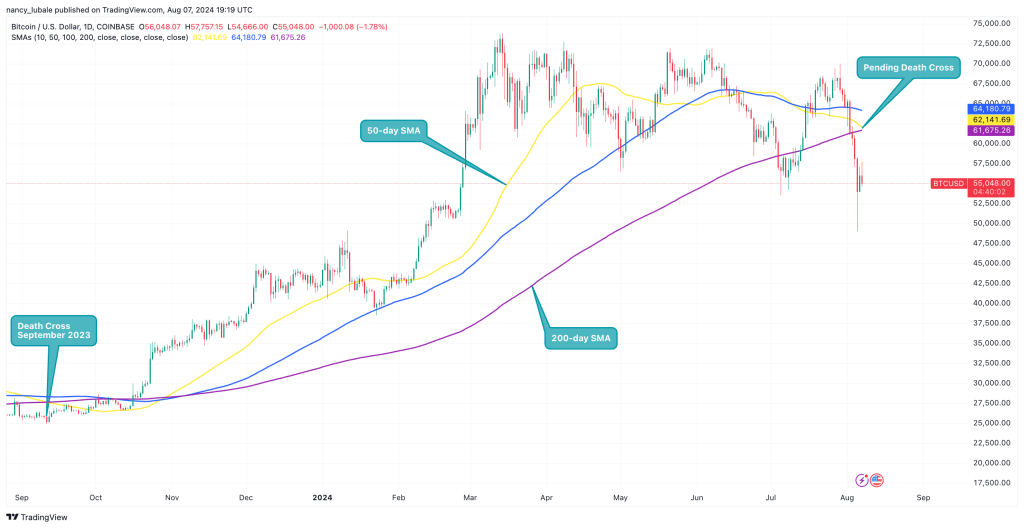
Currently, Bitcoin’s 50-day SMA is at $62,141 and declining, indicating a possible crossover with the 200-day SMA at $61,676.
This imminent crossover indicates Bitcoin’s short-term momentum is below its long-term price momentum, which usually triggers heightened fear and impulsive reactions among investors.
From a historical perspective, the death cross has a poor track record in accurately predicting future price trends. It often leads to a “bear trap” – a reversal against a bearish move that can force traders to abandon their short positions amidst rising losses.
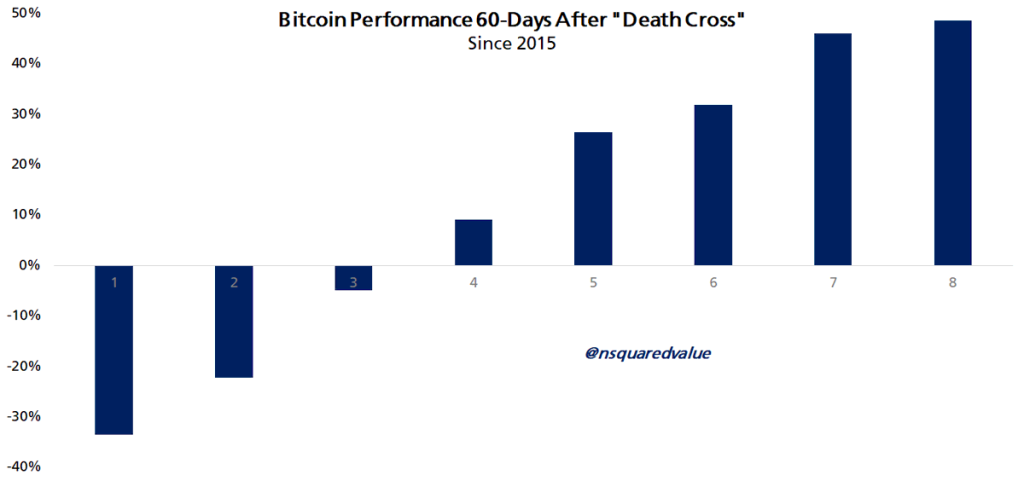
To clarify this, Bitcoin analyst Timothy Peterson shared a historical chart showing BTC’s price performance one to two months after a “Death Cross” occurs.
“Death Cross is not too dangerous,” Peterson said, explaining that this has happened eight times since 2015, with BTC prices rising 67% two months after the crossover.
“This has happened only 8 times since 2015. What happens next? 60 days later, Bitcoin rises 62% of the time. Average profit is +18%.”
From the above BTC/USD daily chart, Bitcoin confirmed a death cross on September 12, 2023, triggering a significant bear trap, with BTC bottoming at $24,000 the same day before entering an uptrend reaching a new peak on March 14, 2024.
Therefore, it’s crucial to note that the death cross might not be reliable as a standalone indicator.
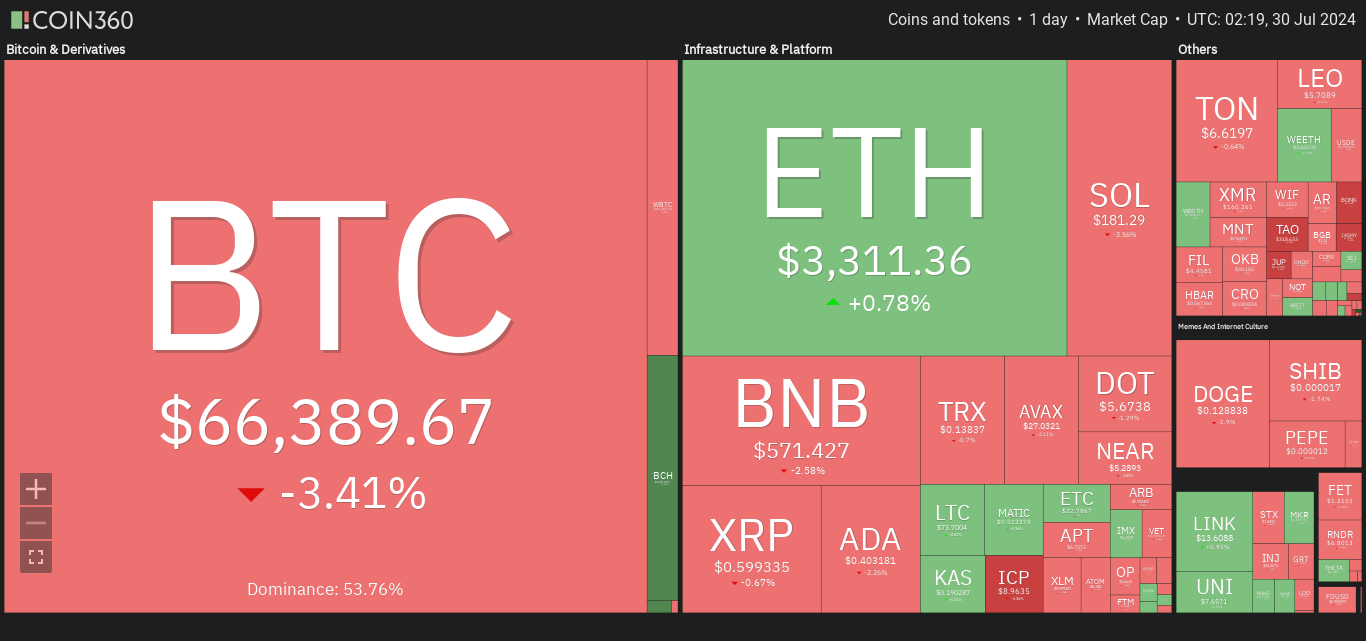
At the time of writing, Bitcoin is trading at $56,500.
Bitcoin’s Upcoming “Super Bull Cycle”
Anonymous trader Trader Tardigrade supported the bear trap hypothesis, claiming that Bitcoin’s recent decline to $49,000 is the beginning of a new “super bull cycle” for BTC.
In an August 6 post on X, the trader shared an analysis from 2013 and said the recent drop “finally printed a wick below the support line,” similar to the previous super cycle from 2016 to 2018.
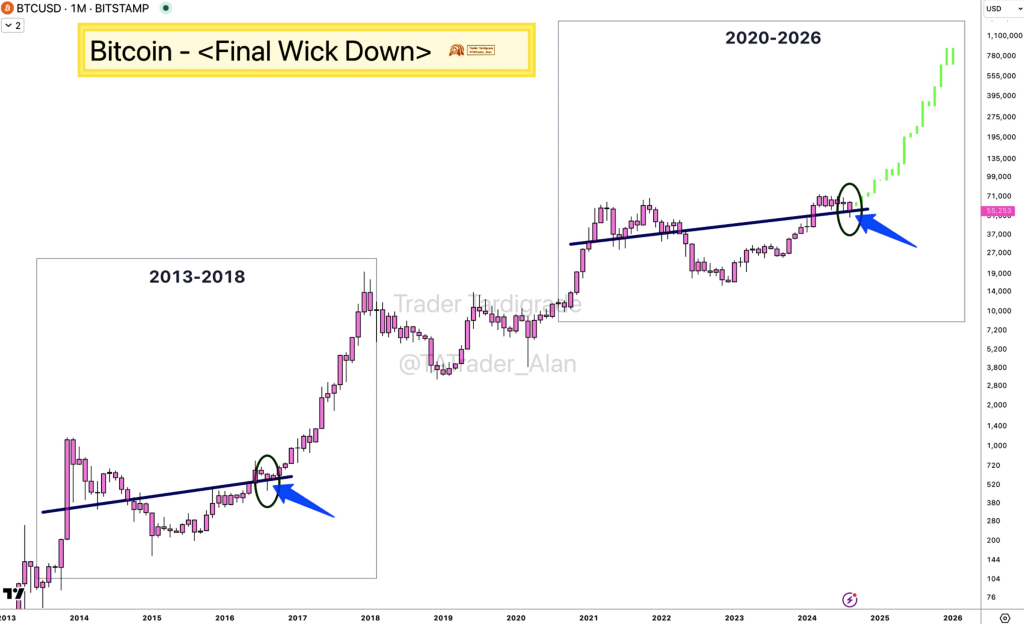
Trader Tardigrade’s analysis shows that Bitcoin made a similar move in 2016, propelling BTC into a parabolic bull run peaking in 2017. According to this analyst, the recent wick printed below the support line could signal a new high in the coming years.
However, it is essential to note that this proposed pattern has only occurred once and may need confirmation in the current cycle. Additionally, the “wick down” might have occurred under different macroeconomic and geopolitical conditions, meaning things may not unfold the same way they did from 2013-2018.
Meanwhile, DeFi Report founder Michael Nadeau stated that he remains optimistic despite events of the past week.
“The situation feels similar to September/October 2020, after Paul Tudor Jones called Bitcoin the “fastest horse,” and Michael Saylor started buying BTC through MicroStrategy’s balance sheet.”
Check BTC prices here.