

Technical Analysis for July 18: BTC, ETH, BNB, SOL, XRP, DOGE, TON, ADA, AVAX, SHIB
Bitcoin (BTC) has been conquering overhead resistance levels one by one, signaling that the bulls are regaining confidence. Data from Farside Investors shows that $422 million flowed into spot Bitcoin ETFs in the US on July 16.
BlackRock’s iShares Bitcoin Trust (IBIT) has once again surpassed $20 billion in assets under management (AUM) after purchasing an additional 4,004 Bitcoins. Previously, the fund surpassed $20 billion in AUM at the end of May. Looking at the massive inflows, ETF Store President Nate Geraci mentioned in a post on X that not only retail investors but also advisors and institutional investors have been buying in.
Bitcoin’s recent surge has improved sentiment, and analysts are speculating about the timing of reaching a new all-time high. While anything can happen in the market, the current rally is expected to face strong selling pressure between $70,000 and the previous all-time high near $74,000. The market is likely to remain volatile in the near term as some creditors of the defunct Mt. Gox exchange have halted selling their payments.
Will Bitcoin’s strength trigger additional buying in altcoins? Let’s analyze the charts of the top 10 cryptocurrencies to find out.
BTC Technical Analysis
Bitcoin has climbed above the 50-day simple moving average (SMA) ($63,926) on July 15, indicating that the bulls are back in control.
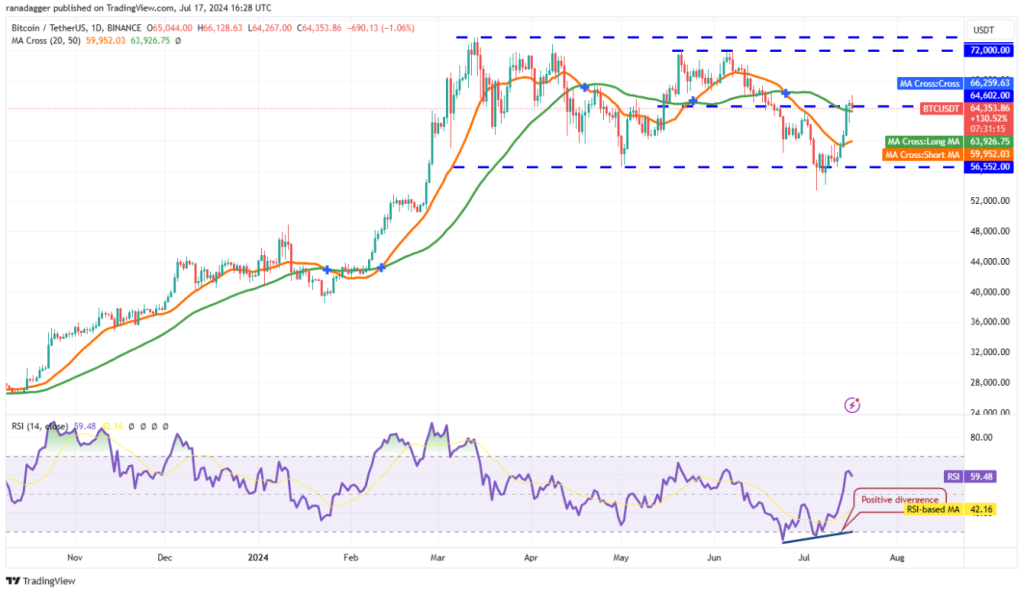
The bears pulled the price below the 50-day SMA on July 16, but the long tail on the candlestick suggests solid buying at lower levels. If the price sustains above the 50-day SMA, it could rise to $70,000.
Conversely, if the price falls and breaks below the 50-day SMA, it will indicate that demand is drying up at higher levels. The bears will then attempt to push the BTC/USDT pair down to the 20-day SMA ($59,952).
ETH Technical Analysis
Ether (ETH) rose to the 50-day SMA ($3,454) on July 15, indicating that the range between $2,850 and $4,094 remains intact.
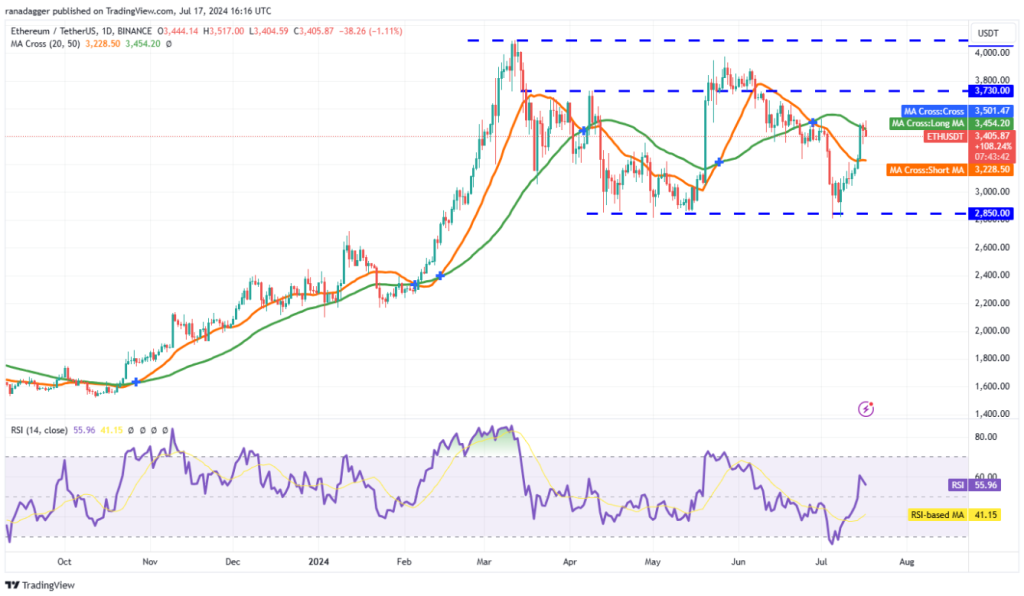
The bulls will try to further solidify their position by pushing the price to $3,730 and then attempting to rise to the overhead resistance at $4,094. Sellers are expected to strongly defend the area between $4,000 and $4,094.
This positive view will be invalidated in the short term if the price drops from the current level and falls sharply below the 20-day SMA ($3,228). The ETH/USDT pair could then retest the crucial support at $2,850. Breaking this support will complete a bearish head and shoulders pattern.
BNB Technical Analysis
The BNB bears are defending the 50-day SMA ($586), but they are struggling to push the price below the 20-day SMA ($544). The long tail on the July 16 candlestick indicates that the bulls are buying on dips.
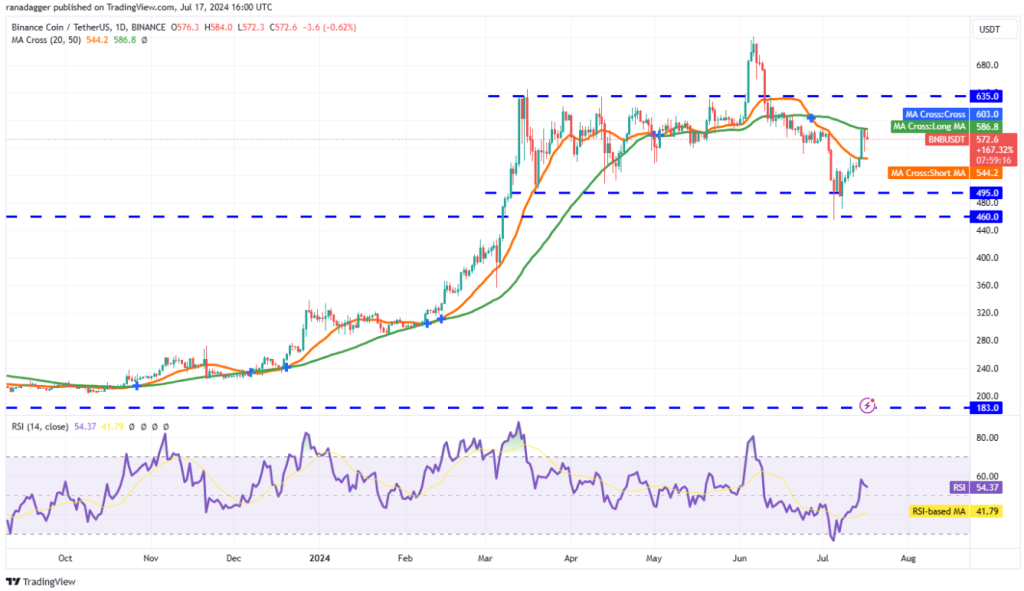
A breakout and close above the 50-day SMA will open the doors for a rally to the overhead resistance at $635. This level could pose a major challenge for the bulls, but if buyers don’t give up much ground, the BNB/USDT pair could start rising to $722.
If the bears want to prevent the uptrend, they will have to quickly pull the price below the 20-day SMA. If they do, it will indicate selling at higher levels. The pair could then drop to the $495 to $460 support zone.
SOL Technical Analysis
Solana (SOL) has been trading inside a descending triangle pattern for a few days. The bulls pushed the price to the downtrend line, where the bears are expected to mount a strong defense.
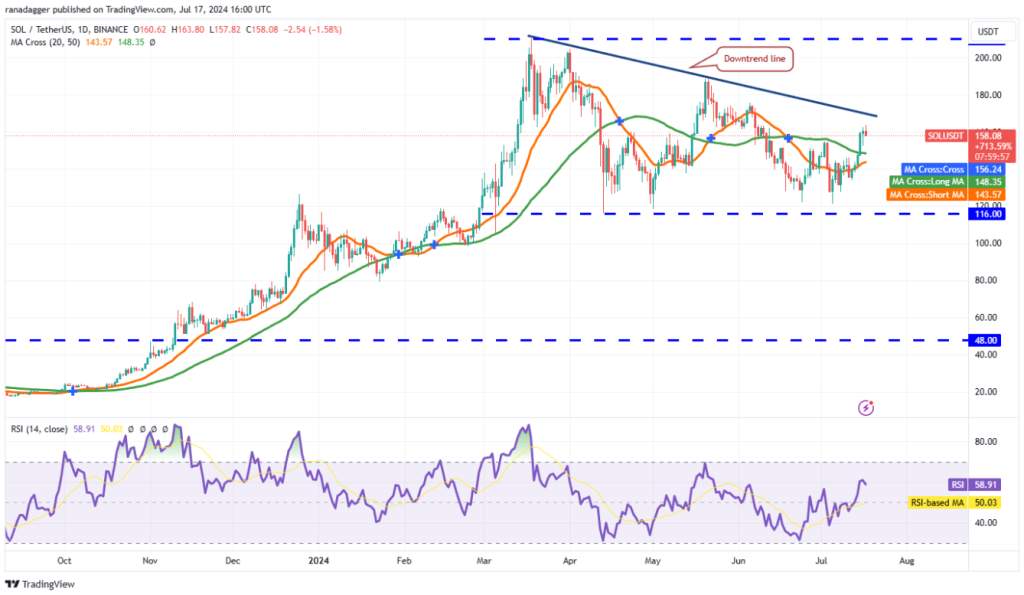
If the price drops sharply from the downtrend line but rebounds from the 20-day SMA ($143), it will indicate a shift in sentiment from selling on rallies to buying on dips. This move will increase the chances of a breakout above the downtrend line. If that happens, the SOL/USDT pair could rise to $189 and then to $210.
Contrary to this assumption, if the price falls and breaks below the 20-day SMA, it will indicate that the pair could remain in the triangle for some more time. A break below $116 will complete the bearish pattern, starting a move to $100.
XRP Technical Analysis
XRP (XRP) has made a strong comeback in the past few days, bringing the bulls back into the driver’s seat.
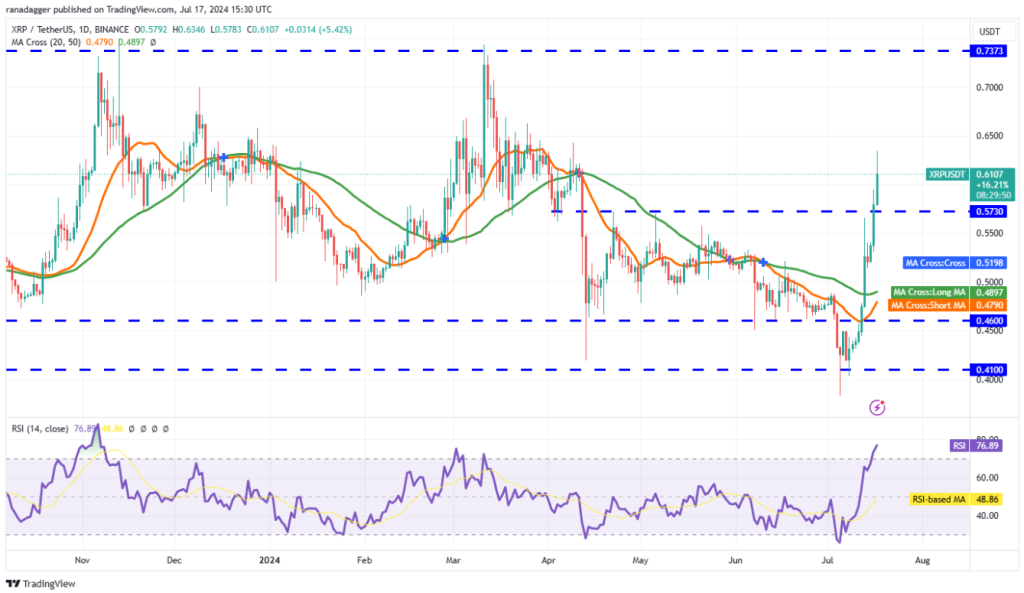
The bears tried to stall the rally at $0.57, but the bulls broke above the resistance on July 16. The moving averages are on the verge of a bullish cross, and the RSI is in the overbought zone, indicating that the bulls are in control.
However, a short-term pullback cannot be ruled out. The first support on the downside is $0.57. If the bulls flip this level into support, the XRP/USDT pair could soar to $0.67 and then to $0.74. The bullish momentum will weaken if the price breaks and sustains below $0.57.
DOGE Technical Analysis
The bulls pushed Dogecoin (DOGE) back above the breakout level of $0.12 on July 15, signaling that the market has rejected lower levels.
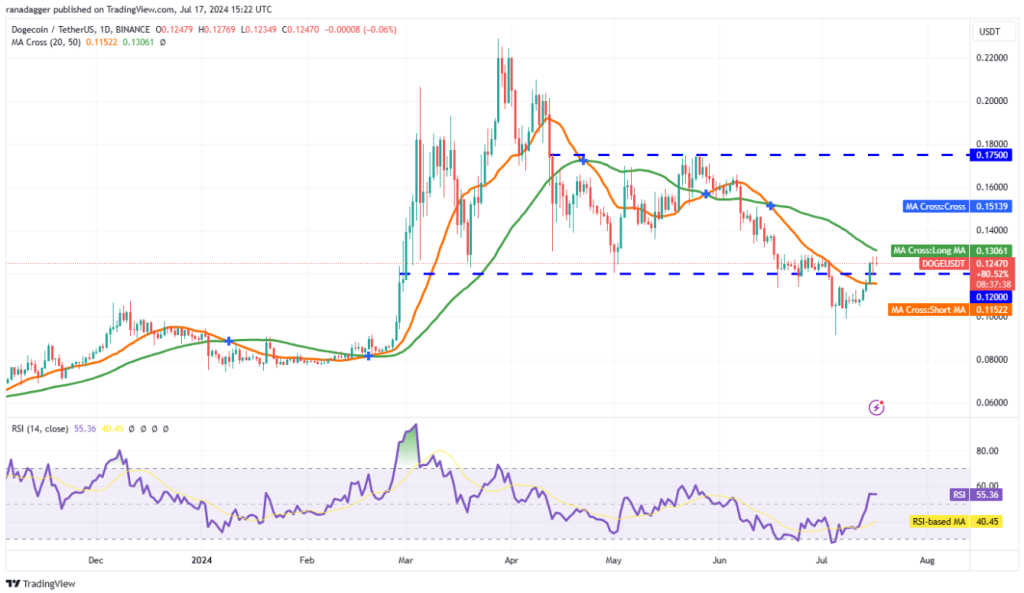
The bears are trying to halt the rally at the 50-day SMA ($0.13). If the price drops but finds support at the 20-day SMA ($0.11), it will indicate that the bulls are buying on dips. This will improve the prospects of a break above the 50-day SMA. The DOGE/USDT pair could then rise to $0.15 and eventually to $0.18.
Conversely, if the price falls and breaks below the 20-day SMA, it will indicate that the bears are active at higher levels. The pair could then drop to $0.10.
TON Technical Analysis
Toncoin (TON) rose above the 20-day SMA ($7.43) on July 15 but fell from the $7.72 resistance.
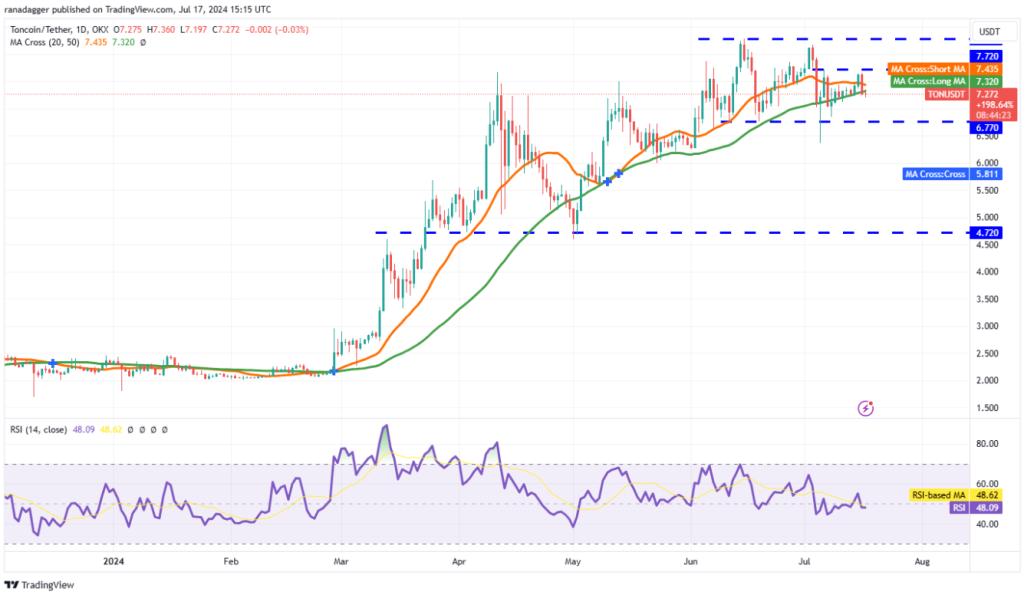
If the price stays below the 50-day SMA ($7.32), the bears will attempt to pull the TON/USDT pair down to $6.77. This is a crucial level for the bulls to defend because failing to do so will complete a double top pattern. This could start a move down to $6 and then to $5.50.
The 20-day SMA is flat, and the RSI is just below the midpoint, giving neither the bulls nor the bears a clear advantage. The bulls will have to push the pair above $7.72 to start a rally to the overhead resistance at $8.29.
ADA Technical Analysis
Cardano (ADA) has sustained above the moving averages for the past few days, indicating weak selling pressure at higher levels.
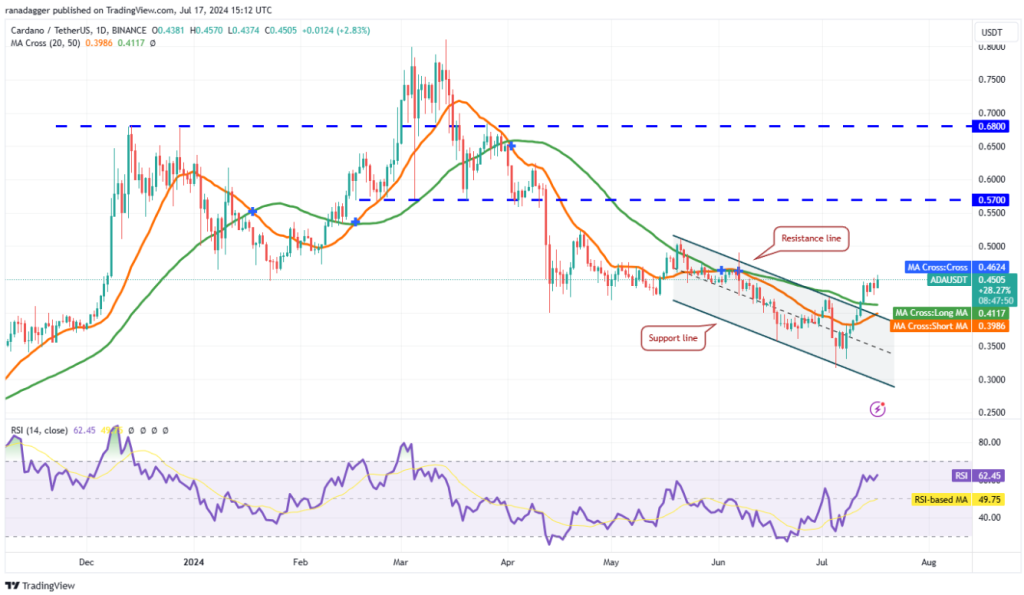
The 20-day SMA ($0.40) has started to rise, and the RSI is in the positive zone, suggesting that the path of least resistance is to the upside. Buyers will try to push the price to the overhead resistance at $0.51.
Contrary to this assumption, if the ADA/USDT pair falls and breaks below the moving averages, it will indicate that the bears have not given up. This could result in range-bound action between $0.32 and $0.45 for some more time.
AVAX Technical Analysis
Avalanche (AVAX) has reached the overhead resistance at $29, where the bears are expected to mount a strong defense.
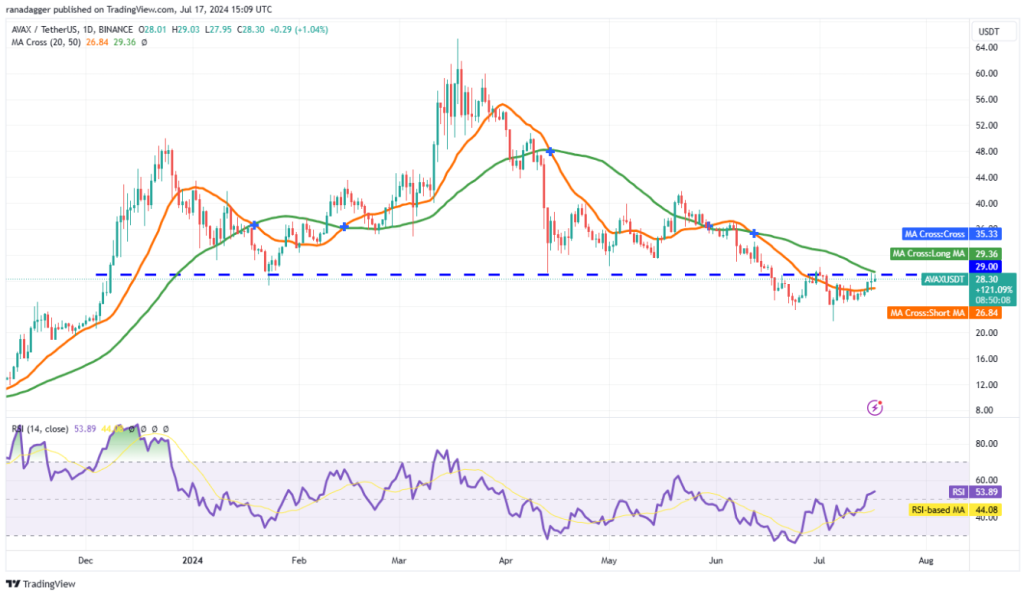
The 20-day SMA ($26.84) has flattened out, and the RSI has risen to the positive zone, indicating a balance between supply and demand. The advantage will tilt in favor of the bulls if they push and sustain the price above $29. If that happens, the AVAX/USDT pair could rise to $34 and then to $37.
If the price drops from the current level and breaks below the 20-day SMA, it will indicate that the pair could remain stuck between $21.80 and $29 for some more time.
SHIB Technical Analysis
Shiba Inu (SHIB) has reached the breakout level of $0.000020 on July 16, where the bears are trying to stall the rally.
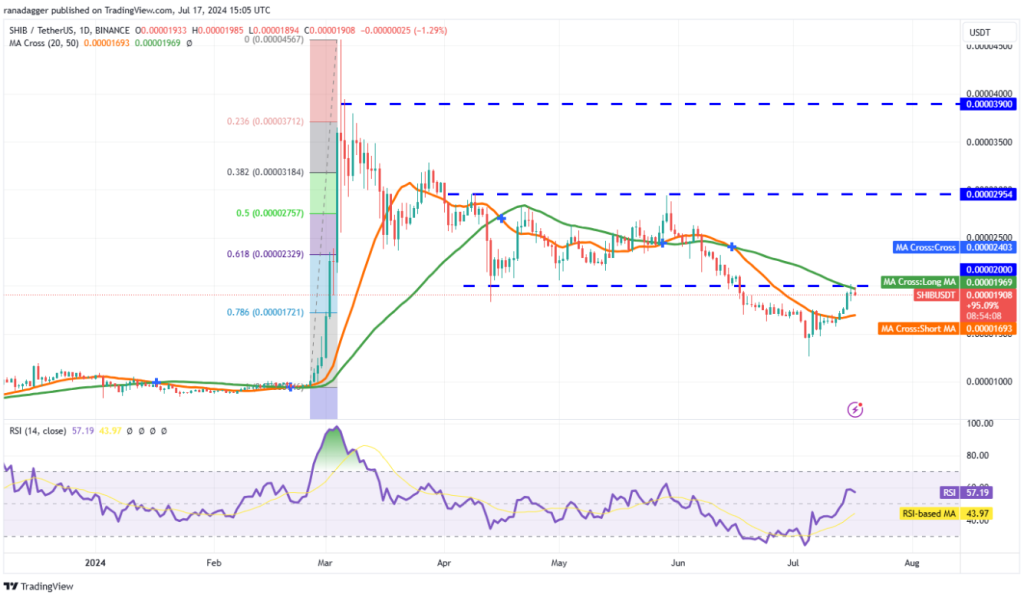
A positive sign in favor of the bulls is that they are not ceding ground to the bears. This indicates that the bulls are holding their positions as they anticipate another leg up. If the price climbs above $0.000020, the SHIB/USDT pair could reach $0.000026.
**Instead, if the price drops sharply from $0.000020, the pair could fall to the 20-day SMA ($0.000017). Such a move could suggest a potential range-bound action between $0.000012 and $0
Besides the capital flow, the BNB Smart Chain network coin project is something investors cannot overlook.

SAFARI FINANCE – the forefront of innovation and breakthroughs in the dynamic field of finance and cryptocurrency.
SAFARI FINANCE is a pioneering technology company based in the United Kingdom, committed to unlocking transformative innovation and breakthroughs in the financial and cryptocurrency sectors. Our journey began with a dream – a vision of creating a decentralized, secure, and user-friendly financial world accessible to everyone.
For more information and to stay updated with the latest news and developments, join our vibrant community:
Website — https://safari.ong/
Telegram — https://t.me/Safarifinance_Group
Twitter ( X ) __ https://x.com/UkSafariFinance
Youtube __ https://www.youtube.com/@SafariFinance